 Dashboards and reporting
The numbers you check every morning, in one view.
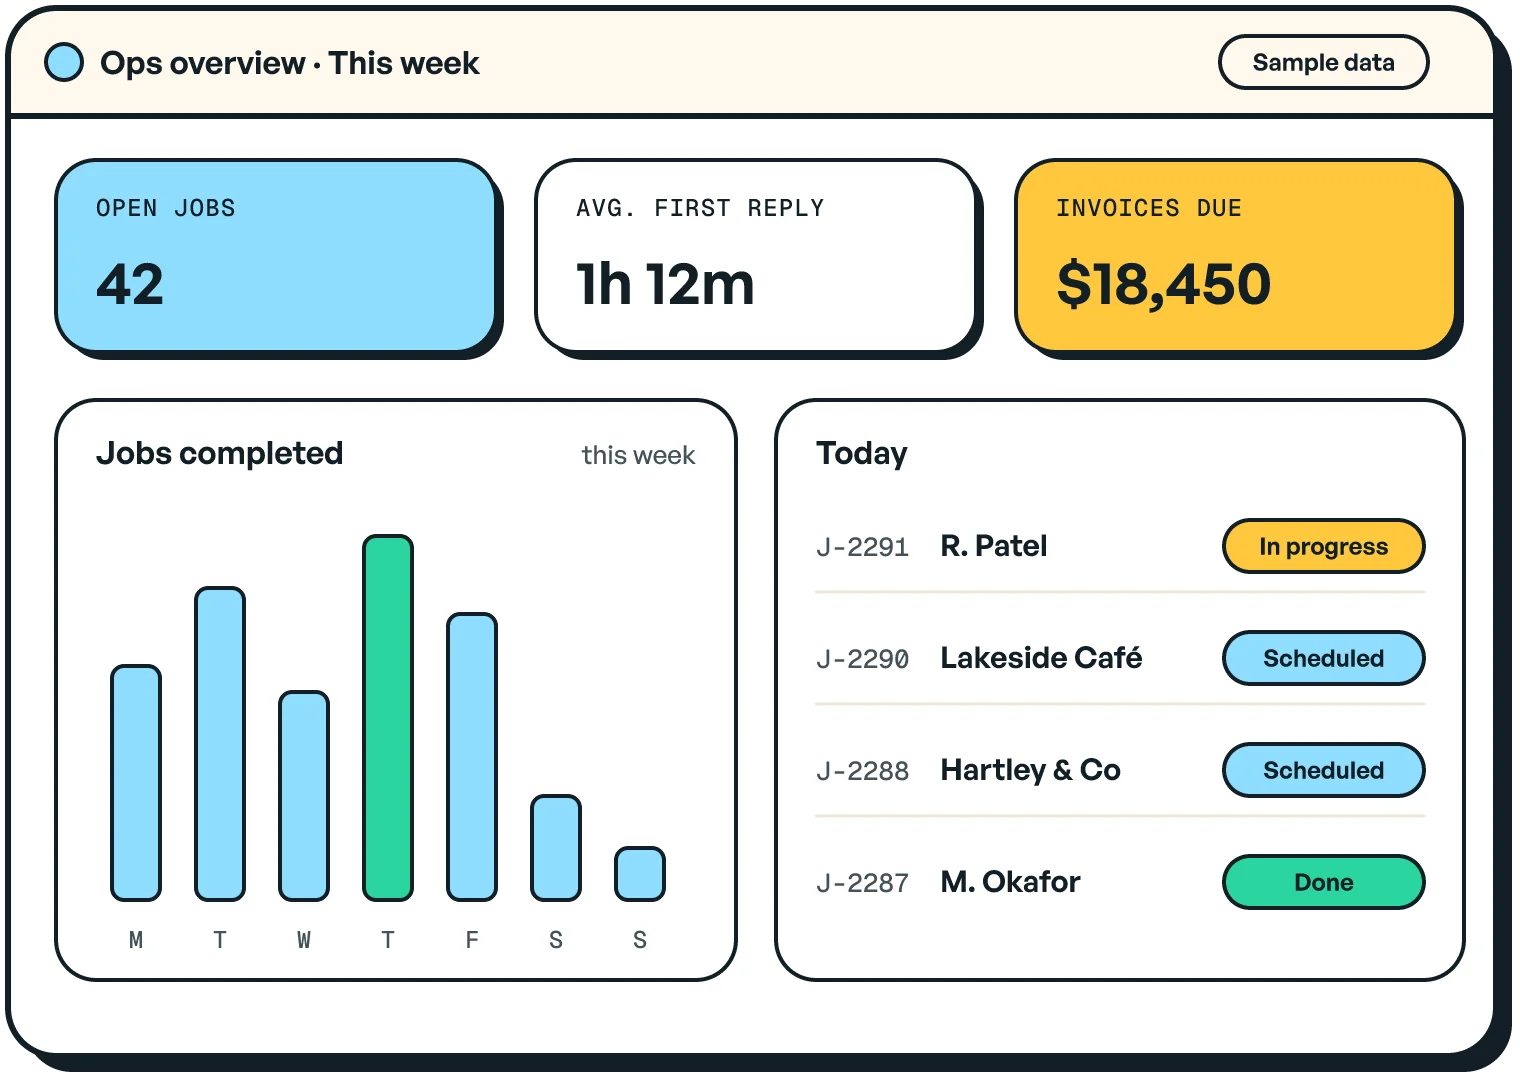
If someone builds the same report by hand every week, that's a dashboard waiting to happen. We pull live data from your tools into one view, with alerts when something needs attention.
Sound familiar?
Where this usually starts
- “Someone spends hours every week copying numbers into a spreadsheet.”
- “Each tool has its own dashboard, and none of them agree.”
- “You find out something went wrong days after it happened.”
What we build
What you get

Live data
Connected to your CRM, accounting, ads, support and database.
Alerts
A message when a number crosses a line you care about.
Exports
Get the data out to a spreadsheet or report whenever you need it.
AI summaries
Optional plain-language summaries of what changed and why it matters.
How we work
From brief to running system
- 1
Send the brief
Five quick questions about what you need and why.
- 2
Scope the first version
A short call, then a written scope and a fixed quote before any work starts.
- 3
See it take shape
Working previews every week, on your real data where possible.
- 4
Launch and improve
We ship it, watch how it's used and fix what gets in the way.
Built by the studio
BNB Analytics
Real-time tracking across 200+ DeFi protocols, with an AI-aggregated news feed and sentiment scoring.
Questions people ask
Why not just use the dashboards our tools already have?
They're fine for one tool. A custom dashboard combines numbers from several tools, uses your own definitions, and shows only what your team acts on.
How live is the data?
As live as the source allows: many tools update within minutes, others once an hour or once a day. We'll tell you which is which during scoping.
Can people outside the company see it?
Yes, with logins and roles, so clients or partners can see only their own numbers.